
Suppose you are a researcher hired by a neighbourhood real estate agency, and your job is to help agents predict how much their clients’ homes will sell for. One theory you keep hearing from the agents is that house prices are closely related to the size of the house. They believe they should be able to predict the price of the house based on its square footage.
To test this theory, you would have to set up a study and use a common research technique called simple regression. This is a statistical method or tool that helps researchers understand the relationship between two items.
For your study, you first have to collect your data. You gather information on the homes that have been sold over the past year. For each house, you need to know its square footage and selling price. You then plot this information on a chart and create what is called a scatter plot (see below).
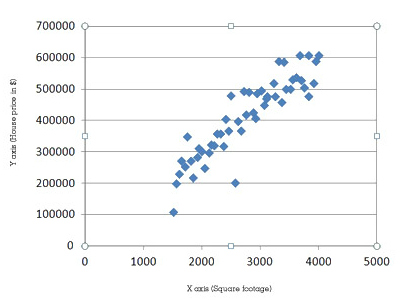 The square footage is shown along the horizontal line, which is referred to as the “X axis.” The item that goes along this axis is called the independent or predictor variable because it is fixed. House price is shown on the vertical line or “Y axis.” This is called the dependent or response variable because it is changeable. That is, the dependent variable (price of house) changes depending on the independent variable (size of house).
Now you conduct your simple regression. A simple regression, often calculated using a software program, creates an equation that best describes the relationship between the two things you looked at in your study or, in other words, best “fits” the dots on your scatter plot.
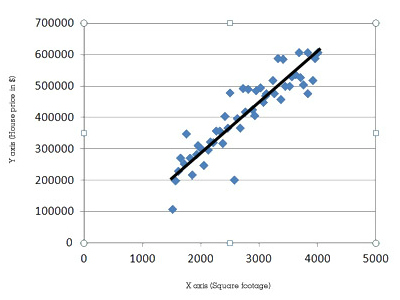
In this case, the simple regression shows you that the equation that best describes the relationship between house price and square footage based on the information you provided is y=150x. That is, the selling price of a house increases by $150 for every square foot increase in size. This equation is easily shown on a graph by a straight line, showing the “best fit” among all the dots on the scatter plot. This line or equation now becomes useful for predicting the selling price of a house. Knowing how big a client’s house is, the real estate agent can predict how much it will sell for.
However, based on the simple regression, you wouldn’t advise the real estate agent to price homes based only on their square footage. You suspect that other things besides house size might account for the price of the house and, therefore, need to be taken into consideration. That’s where multiple regression comes in.
Source: At Work, Issue 86, Fall 2016: Institute for Work & Health, Toronto [This column updates a previous column describing "regression," originally published in 2009.]