
The Institute for Work & Health (IWH) released an Issue Briefing in April 2011 that summarized research by Tompa, Scott-Marshall, Fang and Mustard (2010) on the adequacy of earnings replacement benefits for injured workers with permanent impairments. The research looked at three workers’ compensation benefit regimes: two in Ontario (one before and one after the 1990 change in the system), and one in British Columbia that was in place in the 1980s and 1990s.
As noted in the earlier Issue Briefing, a key objective of workers’ compensation programs is to provide adequate compensation for lost earnings to people who experience work-related injury or illness. Permanent impairment from workplace injury or illness can lead to lower post-injury earnings for a worker for several reasons, including decreased functional ability, disruption of career progression/seniority, a weakened or broken relationship with the injury employer, and stigma attached to being an injured worker.
For the earlier Issue Briefing, Tompa and colleagues linked workers’ compensation data in Ontario and British Columbia with earnings data from Statistics Canada’s Longitudinal Administrative Databank (LAD) for the injury year and nine years post-injury. The LAD contains information on the earnings of a sample of 20 per cent of Canadian tax filers. If selected into the LAD, tax filers are included each year over their entire life.
This Issue Briefing, based on a study by Tompa, Saunders, Mustard and Liao (2013-2015), updates the analysis of benefits adequacy in Ontario by looking at more recent cohorts of permanently impaired workers’ compensation beneficiaries, in particular those injured after changes to Ontario’s workers’ compensation legislation took effect at the beginning of 1998. The updated analysis includes workers whose injuries occurred between 1998 and 2002 (again considering nine years of follow-up data on earnings and benefits after the injury year).
Conceptual issues: A recap
Measuring lost earnings and earnings recovery
Lost earnings and earnings recovery are two ways to describe similar things. For example, we can describe lost earnings as being 10 per cent, or we can say the earnings recovery is 90 per cent. We use both terms in this Issue Briefing.
One way to measure lost earnings is to compare a worker’s earnings after the date of injury with his or her earnings prior to the injury. This would correspond to how workers’ compensation benefits programs are generally designed to restore a percentage of pre-injury earnings.
However, as a measure of lost earnings, this approach has an important limitation. Many things may affect the earnings of an individual over time, other than a work injury, so it is difficult to determine how much is due to the work injury. Examples of these other influences include: accumulated work experience (which can be affected by work injury, but can also affect earnings in the absence of work injury), the acquisition of new skills and knowledge, and labour market conditions. These influences may vary with the characteristics of the worker, such as age and gender. For example, a worker who was injured at a very young age might have had a low pre-injury wage rate, but the expectation of a much higher wage rate as he or she gained experience and knowledge. In such a case, comparison of post- to pre-injury earnings would understate the earnings loss. The opposite is likely for workers transitioning into retirement.
This problem may be addressed by using comparison or control groups made up of workers with similar earnings to the injured worker prior to the date of injury [see, for example, studies in the United States by Biddle (1998); Boden and Galizzi (1999); Reville (1999); Reville et al. (2001a); Reville et al. (2001b)].
An example of the use of controls to measure earnings loss is a study by Bhattacharya et al. (2010) that investigated earnings losses of permanent partial disability claimants in California from 1991 to 1997. Post-injury earnings of the claimants were compared with those of controls at the same firm with earnings similar to the injured workers before the injury. Earnings losses were compared with impairment levels assessed by neutral physicians. The study found that, for a given type of injury, the impairment level predicts losses reasonably well, but workers with the same impairment level and a different type of injury (i.e., a different body part affected) may experience earnings losses that are very different.
The 2011 Issue Briefing focused on the use of controls to identify earnings losses. In that study, each workers’ compensation claimant found in the LAD was matched with up to 10 other people also in the LAD. The controls were matched with the claimants based on a number of characteristics, including similar wage and salary earnings in each of the four years prior to the injury year, and the same gender, age and province of residence. Most controls had pre-injury labour market earnings within 10 per cent of their claimant counterparts, and the remainder had earnings within 10 to 20 per cent of their claimant counterparts.
In this Issue Briefing, we present benefits adequacy results using both methods of comparison: how permanently impaired workers did compared to their pre-injury earnings and how they did compared to controls (i.e. people like them except for the injury).
Defining the replacement rate
A second issue in measuring the adequacy of workers’ compensation benefits is how best to measure the degree to which benefits compensate for lost earnings. The U.S.-based studies mentioned above measure the proportion of lost earnings that are replaced by workers’ compensation benefits. We refer to this as the loss replacement rate.
An alternative approach—the one used in this and the earlier Issue Briefing— is to measure the extent to which the combination of post-injury earnings and workers’ compensation benefits replace the earnings a worker would have had if not for the injury. This can be measured using pre-injury or control group earnings. We refer to this as the earnings replacement rate.
The target replacement rate used as a test of the adequacy of workers’ compensation benefits in replacing lost earnings is often the replacement rate used in benefit programs that compensate people who are temporarily off work but recover fully. For example, the post-1990 Ontario legislation (known as Bill 162) had a target replacement rate of 90 per cent of after-tax pre-injury earnings for total temporary disability. The post-1998 Ontario regime (known as Bill 99) has a target replacement rate of 85 per cent.
Key findings of 2011 Issue Briefing
For all three of the workers’ compensation programs examined (Ontario, late 80s; Ontario, early 90s; B.C., early 90s), benefits for permanently disabled claimants were adequate on average. For every category of physical impairment, the average after-tax earnings replacement rate was at least 90 per cent. The overall average earnings replacement rate was 99 per cent for the two Ontario programs and 104 per cent for the B.C. program.
There was considerable variation in post-injury labour market earnings within each impairment category. There was also some variation in the earnings replacement rates, especially in the lower impairment categories. For levels of physical impairment of 50 per cent or more, about eight in 10 claimants in the two Ontario programs, and all claimants in the B.C. program, had an earnings replacement rate of at least 75 per cent. In the Ontario programs, about one-third of those with less than 50 per cent impairment had an earnings replacement rate of less than 75 per cent.
The percentage of claimants that achieved at least a 90-per-cent earnings replacement rate was 50 per cent for the pre-1990 Ontario program, 54 per cent for the post-1990 Ontario program, and 60 per cent for the B.C. (pre-Bill 49) program.
The inclusion of CPP benefits
In May 2013, the research team reported results of a supplemental analysis that described the impact of Canada Pension Plan Disability (CPP-D) payments on the adequacy of wage-replacement benefits provided by Ontario’s workers’ compensation system. Although the CPP-D benefit has been available since 1970, the receipt of CPP disability benefit income has been reported separately on income tax forms only since 1992. Accordingly, the supplementary analysis applied only to those injured in 1992-1994. For permanent impairment beneficiaries who have been awarded a CPP-D benefit, the amount of the CPP-D benefit is deducted from the benefits paid by the workers’ compensation board. The inclusion of CPP-D benefits had a minor influence on the calculation of after-tax earnings replacement rates, increasing the average replacement rate by three percentage points, from 102 per cent for these cohorts to 105 per cent. For injuries occurring in the full 1990-94 period, the average earnings replacement rate without including CPP-D benefits was 99 per cent.
Benefits adequacy after 1998 reforms
Tompa and his team recently completed its update of the initial findings reported above by analyzing benefits adequacy in Ontario for those injured in the years 1998-2002, after significant changes were made to Ontario’s workers’ compensation legislation. Bill 99, which came into effect on January 1, 1998, brought about a number of changes to benefits and services provided by the Ontario workers’ compensation system. Loss of Earnings (LOE) benefits for both short- and long-term disability claimants replaced distinct shortand long-term disability benefits under Bill 162. LOE benefits are based on an assessment of lossof- earnings capacity similar to the Future Economic Loss (FEL) assessment used in the pre-1998 system, but are not undertaken at set intervals. LOE benefits are based on a rate of 85 per cent of pre-injury post-tax earnings. After six years, benefits are locked in until age 65. At age 65, a pension is paid from funds set aside for the claimant.1 As before 1998, permanently impaired workers also receive a non-economic loss (NEL) benefit, usually awarded as a lump sum, based on the degree of permanent impairment and the age of the worker at the time of the injury.
Changes were also made to the vocational rehabilitation system. Previously, it had been administered by the Workers’ Compensation Board, but was replaced by a Labour Market Re-entry system with third-party delivery of services. Furthermore, a program of early and safe return to work was introduced in which employers were encouraged to accommodate injured workers by providing modified work, with an emphasis on self-reliance in managing the consequences of work injuries.
Labour market earnings postinjury
The after-tax earnings of claimants injured between 1998 and 2002 were compared over a 10-year period beginning with the year of injury with (a) the earnings of controls over this period and (b) with pre-injury earnings. These comparisons were made for each of five categories of permanent impairment:
- five per cent permanent impairment and under (20 per cent of the sample);
- six to 10 per cent permanent impairment (21 per cent of the sample);
- 11 to 20 per cent permanent impairment (32 per cent of the sample);
- 21 to 50 per cent permanent impairment (24 per cent of the sample); and
- over 50 per cent permanent impairment (three per cent of the sample).
The researchers examined the share of claimants in each impairment category who experienced after-tax earnings recovery of less than 25 per cent, 25-50 per cent, 50-75 per cent, 75-100 per cent, 100-125 per cent and over 125 per cent, over the 10-year period, beginning with the year of injury.
a. Comparison with controls
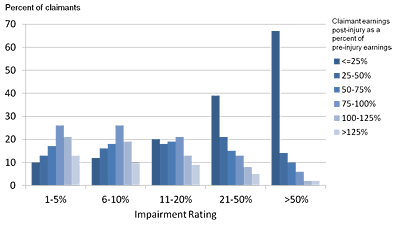
As shown in Chart 1 and Table 1, claimants in each impairment category experienced, on average, lower levels of labour market earnings after injury relative to their control counterparts. As expected, those in the higher impairment categories experienced greater earnings losses. For example, 67 per cent of those with an impairment level over 50 per cent had earnings less than 25 per cent of what controls earned, and two per cent of this group earned more than 125 per cent of what controls earned. In contrast, only 10 per cent of those with an impairment level of five per cent and under earned less than 25 per cent of what controls earned, while 14 per cent of this group earned more than 125 per cent of what controls earned.
Chart 1/Table 1: Distribution of labour market earnings of claimants over 10 years post-injury as a percentage of labour market earnings of controls, by impairment rating (NEL category), Ontario LOE program, injury years 1998-2002

| <=25% | 25-50% | 50-75% | 75-100% | 100-125% | >125% | |
|---|---|---|---|---|---|---|
| 1-5% impairment | 10% | 13% | 18% | 24% | 21% | 14% |
| 6-10% impairment | 12% | 16% | 18% | 24% | 18% | 13% |
| 11-20% impairment | 20% | 19% | 18% | 21% | 13% | 9% |
| 21-50% impairment | 39% | 21% | 16% | 13% | 7% | 5% |
| >50% impairment | 67% | 14% | 10% | 6% | 2% | 2% |
| Entire sample | 22% | 18% | 17% | 20% | 14% | 10% |
b. Comparison with pre-injury earnings
Chart 2 and Table 2 look at earnings by level of impairment in the 10 years beginning with the injury year compared to what the injured worker had earned pre-injury. The pattern of earnings recovery by impairment group is almost identical to that seen when the comparison is with controls rather than pre-injury earnings. The key difference in results between the two methods is in the pattern by age group. Earnings recovery looks better for younger workers and worse for older workers when the comparison is with preinjury earnings rather than with control counterparts (not shown in the chart or table). For example, 41 per cent of injured workers 24 years of age or less at time of injury recovered 125 per cent or more of their pre-injury earnings, compared to 16 per cent for this recovery category when compared to controls. In contrast, five per cent of injured workers aged 55-59 at time of injury recovered 125 per cent or more of their pre-injury earnings, compared to 15 per cent for this recovery category when compared to controls.
Chart 2/Table 2: Distribution of labour market earnings of claimants over 10 years post-injury as a percentage of claimant pre-injury earnings, by impairment rating (NEL category), Ontario LOE program, injury years 1998-2002
|
|
<=25% | 25-50% | 50-75% | 75-100% | 100-125% | >125% |
|---|---|---|---|---|---|---|
| 1-5% impairment | 10% | 13% | 17% | 26% | 21% | 13% |
| 6-10% impairment | 12% | 16% | 18% | 26% | 19% | 10% |
| 11-20% impairment | 20% | 18% | 19% | 21% | 13% | 9% |
| 21-50% impairment | 39% | 21% | 15% | 13% | 8% | 5% |
| >50% impairment | 67% | 14% | 10% | 6% | 2% | 2% |
| Entire sample | 22% | 17% | 17% | 21% | 14% | 9% |
Earnings replacement rates
a. Comparison to controls
To calculate earnings replacement rates, after-tax earnings and workers’ compensation benefits were added over the 10-year period beginning with the year of injury.2 For injured workers, any CPP-D benefits and any interest received on workers’ compensation benefits over the 10-year period were also included. This sum was compared with the earnings plus any CPP-D benefits received by the control groups over the 10-year period beginning with the year of injury.
The average earnings replacement rate was 104 per cent; 65 per cent had earnings replacement rates of 85 per cent or more. The addition of interest and CPPD to the calculations made only a small difference. The average replacement rate was 103 per cent when they were not included; 63 per cent had an earnings replacement rate of at least 85 per cent when only earnings plus benefits were considered.
Chart 3 and Table 3 show how the distribution of earnings replacement rates varies by degree of impairment. Those with higher levels of impairment tended to have greater replacement rates. For example, among those with an impairment level of over 50 per cent, 39 per cent had a replacement rate of more than 125 per cent of control group earnings based on earnings plus benefits, and 28 per cent had an earnings replacement rate of between 100 and 125 per cent. For those with an impairment level of five per cent and under, these figures are 19 per cent and 24 per cent, respectively.
Among those with an impairment level of five per cent and under, 29 per cent had an earnings replacement rate of below 75 per cent of control earnings (summing the lowest three replacement rate categories). Among those with an impairment level of above 50 per cent, 10 per cent had an earnings replacement rate of below 75 per cent.
Table 3 also shows the overall distribution of earnings replacement rates (with control earnings as the comparison) across the entire sample; that is, putting together the data across all the impairment categories. These data show that 25 per cent of the sample had replacement rates of under 75 per cent (summing the three lowest categories), and 46 per cent of the sample had replacement rates of 100 per cent or more (summing the two highest categories).
Chart 3/Table 3: Distribution of earnings replacement rates of claimants over 10 years post-injury relative to income of controls, by impairment rating (NEL category), Ontario LOE program, injury years 1998-2002
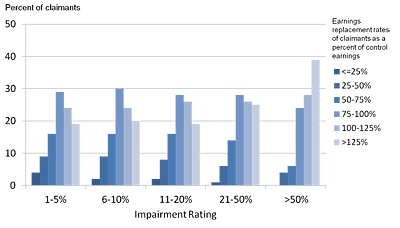
| <=25% | 25-50% | 50-75% | 75-100% | 100-125% | >125% | |
|---|---|---|---|---|---|---|
| 1-5% impairment | 4% | 9% | 16% | 29% | 24% | 19% |
| 6-10% impairment | 2% | 9% | 16% | 30% | 24% | 20% |
| 11-20% impairment | 2% | 8% | 16% | 28% | 26% | 19% |
| 21-50% impairment | 1% | 6% | 14 | 28% | 26 | 25% |
| >50% impairment | 0% | 4% | 6% | 24% | 28% | 39% |
| Entire sample | 2% | 7% | 16% | 28% | 25% | 21% |
Earnings replacement for claimants combines after-tax labour market earnings, compensation benefits, Canadian Pension Plan Disability benefits and interest payments. Control income combines labour market earnings and Canadian Pension Plan Disability benefits.
b. Comparison to pre-injury earnings
Chart 4 and Table 4 look at the distribution of earnings replacement rates by level of impairment, where the comparison is to what the injured worker had earned pre-injury. The overall pattern is similar to that of the comparison with control counterparts.
The overall average earnings replacement rate using this method is 111.5 per cent with CPP-D benefits and interest on workers’ compensation benefits included in the calculation, and 110 per cent without.
Chart 4/Table 4: Distribution of earnings replacement rates of claimants over 10 years post-injury relative to claimant pre-injury earnings, by impairment rating (NEL category), Ontario LOE program, injury years 1998-2002
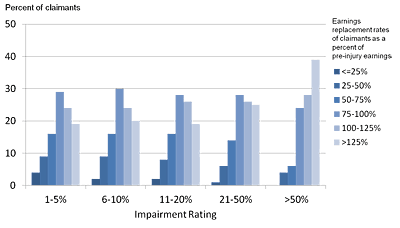
| <=25% | 25-50% | 50-75% | 75-100% | 100-125% | >125% | |
|---|---|---|---|---|---|---|
| 1-5% impairment | 4% | 8% | 16% | 27% | 26% | 18% |
| 6-10% impairment | 3% | 8% | 14% | 30% | 27% | 17% |
| 11-20% impairment | 2% | 7% | 16% | 29% | 27% | 20% |
| 21-50% impairment | 1% | 5% | 13% | 29% | 28% | 25% |
| >50% impairment | 0% | 4% | 6% | 23% | 29% | 38% |
| Entire sample | 2% | 7% | 15% | 29% | 27% | 21% |
Earnings replacement for claimants combines after-tax labour market earnings, compensation benefits, Canadian Pension Plan Disability benefits and interest payments
Table 5 shows the average earnings replacement rates by level of impairment for both methods of comparison (controls and pre-injury earnings). This table shows that workers with higher levels of impairment tended to have higher replacement rates. This may, in part, reflect the higher NEL benefits received by claimants with higher impairment levels.
Table 5: Average earnings replacement rates of claimants over 10 years post-injury, by impairment rating (NEL category), Ontario LOE program, injury years 1998-2002
| Relative to control group income | Relative to claimant pre-injury earnings | ||||
| Without CPP-D | Including CPP-D | Without CPP-D | Including CPP-D | ||
|---|---|---|---|---|---|
| 1-5% impairment | 0.963 | 0.972 | 1.012 | 1.025 | |
| 6-10% impairment | 0.997 | 1.002 | 1.062 | 1.068 | |
| 11-20% impairment | 1.025 | 1.030 | 1.143 | 1.151 | |
| 21-50% impairment | 1.091 | 1.119 | 1.129 | 1.160 | |
| >50% impairment | 1.209 | 1.279 | 1.237 | 1.303 | |
| Entire sample | 1.028 | 1.041 | 1.099 | 1.115 | |
Earnings replacement for claimants combines after-tax labour market earnings, compensation benefits, Canadian Pension Plan Disability benefits and interest payments. Control income combines labour market earnings and Canadian Pension Plan Disability Benefits.
Variability of earnings recovery and replacement rates
As noted earlier, labour market earnings following injury can vary for a variety of reasons. To examine earnings variability in the labour market generally, the research team selected one member of each control group and compared the earnings of the selected controls over the 10-year period with those of the rest of their control groups. The range of these earnings ratios was similar to the range of replacement rates for permanently impaired injured workers shown in Table 3, with slightly greater variability seen in the earnings ratios of the controls. These findings suggest the variability in the post-injury experience of claimants is similar to the variability in labour market earnings of uninjured workers.
Conclusions
Workers’ compensation benefits for permanently disabled claimants in Ontario under the program that took effect in 1998 fully compensated for lost earnings, on average. The average earnings replacement rate, when compared to the earnings of controls, was 104 per cent; 65 per cent of the permanent impairment claimants had an earnings replacement rate of 85 per cent or more (85 per cent is the rate used in the post-1998 Ontario legislation to determine benefit payments). This figure is higher than the average earnings replacement rate of 99 per cent for the pre-1998 Ontario program reported in our 2011 Issue Briefing. About half of this difference is accounted for by the inclusion of interest on benefits and CPP-D benefits in the more recent analysis.
When the comparison is to pre-injury earnings, the average earnings replacement rate for the post-1998 program was 111 per cent with inclusion of interest and CPP-D benefits. The main difference in the results for the two methods of comparison is seen in the breakdown by age group.
The use of controls to determine earnings losses and replacement rates is preferred to the use of pre-injury earnings as the comparator, since the former is better able to account for influences beyond the injury on postinjury earnings.
Similar to our findings for the pre-1998 program in Ontario, there is some variation around the average in the earnings replacement rates. About 46 per cent of the sample had replacement rates of 100 per cent or more, while 25 per cent had replacement rates of under 75 per cent (for estimates based on labour market earnings plus interest plus CPP-D benefits compared to control earnings plus CPP-D benefits).
It is important to keep in mind that our findings relate to workers with injuries that occurred in the period 1998-2002 (owing to the use of a nine-year post-injury follow up period), and so do not include more recent cohorts.
1 Specifically, five per cent of LOE benefits is set aside with each payment and invested on behalf of the claimant (AWCBC, 2005). The worker may choose to also contribute five per cent directly from his or her LOE benefits. The amount accumulated from these funds till age 65 is used to provide a pension, which can be paid as a lump sum or annuity.
2 All dollar amounts were adjusted to constant dollars and discounted to the injury year using a three per cent discount rate.
References
- Association of Workers’ Compensation Boards of Canada (AWCBC). Comparison of Workers’ Compensation Benefits and Rehabilitation Services in Canada, 2005. Mississauga: AWCBC/ACATC.
- Bhattacharya J, Neuhauser F, Reville RT, Seabury S. Evaluating permanent disability ratings using empirical data on earnings losses. Journal of Risk and Insurance, 2010; 77(1):231-260.
- Biddle J. Estimation and analysis of long term wage losses and wage replacement rates of Washington State workers’ compensation claimants. Working Paper. Olympia, WA: Washington State Workers’ Compensation System, 1998.
- Boden LJ, Galizzi M. Economic consequences of workplace injuries and illnesses: lost earnings and benefit adequacy. American Journal of Industrial Medicine, 1999; 36(5):487-503.
- Institute for Work & Health. Examining the adequacy of workers’ compensation benefits. Issue Briefing, 2011.
- Institute for Work & Health. Supplemental report: The adequacy of workers’ compensation benefits, 2013.
- Reville RT, Boden LJ, Biddle J, Mardesich C. An evaluation of New Mexico workers’ compensation permanent partial disability and return to work. Santa Monica, CA: Rand Institute for Civil Justice, 2001a.
- Reville RT, Polich S, Seabury S, Giddens E. Permanent disability at private, self-insured firms: a study of earnings loss, replacement, and return to work for workers’ compensation claimants. Santa Monica, CA: Rand Institute for Civil Justice, 2001b.
- Reville RT. The impact of a disabling workplace injury on labor force participation and earnings. In: Haltiwanger JC, Lane JI, Spletzer JR, Theeuwes JJM, Troske KR, editors. The Creation and Analysis of Employer-Employee Matched Data (Contributions to Economic Analysis). Amsterdam: North Holland, 1999.
- Tompa E, Saunders R, Mustard C, Liao Q. Impairment and work disability of workers’ compensation claimants in Ontario: A cohort study of new claimants from 1998-2006. CIHR, Operating Grant, 2013-2015.
- Tompa E, Scott-Marshall H, Fang M, Mustard C. Comparative benefits adequacy and equity of three Canadian workers’ compensation programs for long-term disability. Institute for Work & Health Working Paper 350, 2010.