
In 2009, the Institute for Work & Health (IWH) published an Issue Briefing summarizing previous research on the impact of the business cycle on workers’ compensation claim rates. The briefing noted that there has been a long-term trend in Canada, the United States and other developed countries towards fewer workers’ compensation claims per hours worked. The research suggests that, relative to this trend, the frequency of workers’ compensation claims per hours worked tends to decline in recessions and increase in times of economic recovery.
In this Issue Briefing, we look at changes in accepted compensation claims in the most recent recession by examining data from several provinces for the years 2006 to 2010. The global financial crisis that climaxed in 2008 triggered recessions in most developed economies. Canada experienced a shallower and shorter recession than many of our trading partners. Three central questions arise regarding the impact of the recession on the frequency of workers’ compensations claims in Canada:
- Given the relatively mild recession, did claim frequency decrease as expected?
- Were the effects of the recession on claim frequency most significant in those provinces hardest hit by the recession?
- Did those industries hardest hit see the largest decreases in claim frequency?
This Issue Briefing examines data from three industry groups across five provinces to provide answers to these key questions.
Scope and approach
The 2008-2009 recession was experienced unevenly across Canadian provinces and economic sectors. Alberta, British Columbia and Ontario saw substantial decreases in hours worked from 2008 to 2009, while Saskatchewan and Manitoba recorded much smaller decreases. Some economic sectors, such as construction, are more sensitive to the business cycle, while sectors dominated by public-sector expenditures, such as health care, are less sensitive to the business cycle. To take these complexities into account, this briefing analyzes trends in employment and trends in compensation claims by both province and industry. The briefing focuses on the experiences of five provinces (Ontario, Manitoba, Saskatchewan, Alberta and British Columbia) and three key industries (construction, health care and transportation).
The briefing draws on two key sources of data. Counts of lost-time claims (LTCs) and no-lost-time claims (NLTCs) were obtained from provincial workers’ compensation boards, through published statistical supplements and custom data requests.
In the province of Ontario, the Workplace Safety and Insurance Board (WSIB) provides wage-replacement benefits and health-care payments for work-related injuries and illnesses. A work injury or illness is classified as “lost time” if, after the day of injury or onset of illness, the worker is absent from work or present at work but earning less pay (through reduced hours of work or lower wages). A work injury or illness is classified as “no-lost time” if the worker requires health care (arising from the work injury or illness), but is not absent from work other than the day of injury or illness, and suffers no loss in pay as a result of the injury/illness.
Under existing legislation in Ontario, the types of injuries that should be submitted as NLTCs are:
- less severe injuries that require health care, but not time off work;
- injuries where the worker cannot return to normal duties the next day, but can do another job or his/her current job with modifications, and the worker remains on full pay (sometimes referred to as workplace “accommodation”); and
- claims submitted as a result of chronic work-related diseases, after the worker has stopped participating in the labour force (i.e. retired).
Similar principles are applied in Manitoba, Saskatchewan, Alberta and British Columbia, although the administrative classification of a “modified duty episode” may differ among provinces.
Data on hours worked and employment were acquired from the Labour Force Survey, administered by Statistics Canada. Information was obtained for each of the five years from 2006 to 2010. As noted, we obtained information on compensation claims, hours of work and employment for five provinces, as well as for three key sectors in the Canadian economy—construction, transportation and health care—within these five provinces.
Key findings
Findings by province
In the two years prior to the global financial crisis (2006 and 2007), hours of work increased in all five Canadian provinces described in this Issue Briefing (Table 1). The largest increases in hours of work were experienced by British Columbia (4.6 per cent) and Alberta (4.9 per cent), followed by Saskatchewan (3.6 per cent), Manitoba (2.8 per cent) and Ontario (2.2 per cent). Over this two-year period, all provinces (with the exception of British Columbia) recorded a decline in the number of workers’ compensation claims, continuing a long-term trend of a declining incidence of compensated work-related injury and illness in Canada (Mustard et al., 2003).
With the onset of the global financial crisis in mid-2008, unemployment increased and hours of work in the Canadian labour market declined. Between 2008 and 2009, the largest decreases in hours of work were experienced in British Columbia (5.1 per cent), Alberta (5.6 per cent) and Ontario (4.6 per cent). Decreases in hours of work in Saskatchewan (2.7 per cent) and Manitoba (1.8 per cent) were less substantial.
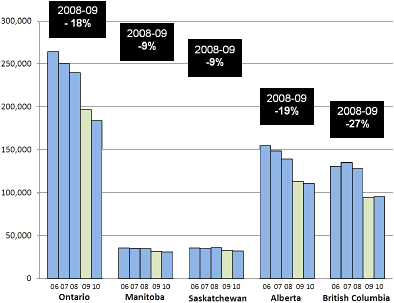
Trends in workers’ compensation claims in the five provinces over the period 2006 to 2010 are shown in Chart 1, above.
The observed declines in workers’ compensation claims over the 2008-2009 period were much greater than the decreases in hours of work. This is consistent with the research findings reported in the earlier Issue Briefing. In British Columbia, the number of compensation claims declined by 26.6 per cent—that is, from 128,282 in 2008 to 94,131 in 2009. In Alberta and Ontario, the number of compensation claims declined by 19 per cent and 18 per cent, respectively. The decline in compensation claims was also substantial in Saskatchewan (nine per cent) and Manitoba (nine per cent).
In all five provinces, the decrease in NLTCs was greater than or equal to the declines in LTCs over the 2008-2009 period (see Table 1). In British Columbia, for example, the number of NLTCs decreased by 33 per cent compared to a reduction of 20 per cent in LTCs.
| Hours | Employed | Workers' compensation claims | |||||
|---|---|---|---|---|---|---|---|
| Year-to-year % change | Lost-time claims | No-lost-time claims | Total claims | Year-to-year % change | |||
| British Columbia | |||||||
| 2006 | 69,808.50 | 1,823,821 | 67,508 | 63,450 | 130,958 | ||
| 2007 | 73,041.10 | 4.63 | 1,889,332 | 68,877 | 69,437 | 135,314 | 3.33 |
| 2008 | 73,259.60 | 0.30 | 1,942,644 | 64,052 | 64,230 | 128,282 | -5.20 |
| 2009 | 69,486.30 | -5.15 | 1,889,021 | 51,171 | 42,960 | 94,131 | -26.62 |
| 2010 | 71,743.00 | 3.25 | 1,891,614 | 50,690 | 44,830 | 95,520 | 1.48 |
| Alberta | |||||||
| 2006 | 67,819.00 | 1,662.310 | 36,943 | 117,982 | 154,925 | ||
| 2007 | 71,169.00 | 4.94 | 1,735,999 | 34,574 | 114,231 | 148,805 | -3.95 |
| 2008 | 71,975.70 | 1.13 | 1,780,666 | 31,771 | 107,511 | 139,282 | -6.40 |
| 2009 | 67,935.90 | -5.61 | 1,727,035 | 26,320 | 86,792 | 113,112 | -18.79 |
| 2010 | 68,856.80 | 1.36 | 1,741,490 | 24,682 | 86,259 | 110,941 | -1.92 |
| Saskatchewan | |||||||
| 2006 | 16,935.80 | 412,265 | 13,732 | 21,797 | 35,529 | ||
| 2007 | 17,553.70 | 3.65 | 421,687 | 13,166 | 21,670 | 34,836 | -1.95 |
| 2008 | 17,666.60 | 0.64 | 433,813 | 13,093 | 23,112 | 36,205 | 3.93 |
| 2009 | 17,192.10 | -2.69 | 438,718 | 12,141 | 20,794 | 32,935 | -9.03 |
| 2010 | 17,602.80 | 2.39 | 440,596 | 11,574 | 20,672 | 32,246 | -2.09 |
| Manitoba | |||||||
| 2006 | 19,625.00 | 531,252 | 17,142 | 18,608 | 35,750 | ||
| 2007 | 20,184.80 | 2.85 | 544,846 | 17,265 | 17,987 | 35,252 | 1.39 |
| 2008 | 20,261.20 | 0.38 | 559,721 | 17,109 | 17,799 | 34,908 | -0.98 |
| 2009 | 19,902.50 | -1.77 | 557,980 | 15,508 | 16,222 | 31,730 | -9.10 |
| 2010 | 20,152.90 | 1.26 | 556,959 | 15,039 | 15,932 | 30,971 | -2.39 |
| Ontario | |||||||
| 2006 | 215,173.10 | 5,529,544 | 85,958 | 178,248 | 264,206 | ||
| 2007 | 219,834.70 | 2.17 | 5,617,874 | 80,948 | 169,638 | 250,586 | -5.16 |
| 2008 | 220,544.20 | 0.32 | 5,711,166 | 78,313 | 161,671 | 239,984 | -4.23 |
| 2009 | 210,503.80 | -4.55 | 5,581,179 | 64,899 | 131,843 | 196,742 | -18.02 |
| 2010 | 216,481.80 | 2.84 | 5,640,355 | 60,247 | 123,852 | 184,099 | -6.43 |
Findings by economic sector
Table 2 records changes in hours worked and compensation claims for three economic sectors: health care, construction and transportation. Employment in the health-care sector was relatively immune from the influence of the recession. Between 2008 and 2009, hours of work in this sector increased by three per cent in British Columbia, 2.9 per cent in Alberta and approximately one per cent in Ontario. However, there was a marked reduction in the numbers of compensation claims in the health-care sectors in all provinces (with the exception of the health-care sector in Manitoba).
The reduction was particularly marked in British Columbia, a province that saw a 12.1 per cent reduction. Compensation claims declined by 4.7 per cent in Alberta, 5.5 per cent in Saskatchewan and 5.0 per cent in Ontario.
The construction sector in British Columbia and Alberta recorded large reductions in hours of work between 2008 and 2009. In British Columbia’s construction sector, hours of work declined by 14 per cent and the number of compensation claims declined by 37 per cent. In Alberta’s construction sector, hours of work declined by 28 per cent and the number of compensation claims declined by 22 per cent. In Ontario, hours of work in the construction sector fell by 10.6 per cent between 2008 and 2009 and the number of compensation claims declined by 22 per cent. This number declined by 7.0 per cent in Saskatchewan (two per cent increase in hours of work) and 8.6 per cent in Manitoba (four per cent decline in hours of work).
The transportation sectors in British Columbia, Alberta and Ontario recorded the largest reductions in hours of work between 2008 and 2009. In British Columbia’s transportation sector, hours of work declined by 11 per cent and the number of compensation claims declined by 39 per cent. In Alberta, hours of work declined by 2.6 per cent in the transportation sector while the number of compensation claims declined by 25 per cent. And in Ontario, hours of work in the transportation sector declined by six per cent while the number of compensation claims declined by 17.5 per cent. Changes in hours of work and the number of compensation claims were less substantial in Saskatchewan and Manitoba.
Canada’s economy began to recover in 2010. However, with few exceptions, there was no corresponding increase in compensation claim frequency. On average, there was a four per cent drop in the claims rate between 2009 and 2010 across all industries and provinces described in this briefing. The early stage of the Canadian economic recovery appears to have been characterized by modest employment growth and a return to the long-term trend of gradual annual declines in the numbers of workers’ compensation claims.
| 2007 | 2008 | 2009 | 2010 | % change 2008-2009 |
||
|---|---|---|---|---|---|---|
| Health care | ||||||
| British Columbia | Hours | 6,812 | 7,064 | 7,277 | 7,553 | 3.0 |
| Claims | 12,946 | 13,345 | 11,733 | 12,182 | -12.1 | |
| Alberta | Hours | 5,966 | 5,864 | 6,034 | 6,432 | 2.9 |
| Claims | 5,477 | 5,520 | 5,260 | 5,607 | -4.7 | |
| Saskatchewan | Hours | 1,875 | 1,886 | 1,887 | 1,969 | 0.0 |
| Claims | 5,177 | 5,438 | 5,138 | 5,034 | -5.5 | |
| Manitoba | Hours | 2,402 | 2,510 | 2,508 | 2,681 | -0.1 |
| Claims | 4,508 | 4,723 | 4,705 | 4,843 | -0.4 | |
| Ontario | Hours | 20,288 | 20,789 | 20,996 | 21,571 | 1.0 |
| Claims | 22,280 | 23,204 | 22,055 | 21,312 | -5.0 | |
| Construction | ||||||
| British Columbia | Hours | 7,070 | 7,647 | 6,547 | 6,781 | -14.4 |
| Claims | 22,791 | 22,504 | 14,136 | 14,373 | -37.2 | |
| Alberta | Hours | 7,921 | 8,339 | 6,034 | 6,432 | -27.6 |
| Claims | 17,843 | 17,915 | 14,051 | 13,304 | -21.6 | |
| Saskatchewan | Hours | 1,289 | 1,413 | 1,442 | 1,492 | 2.1 |
| Claims | 4,196 | 4,600 | 4,277 | 4,681 | -7.0 | |
| Manitoba | Hours | 1,294 | 1,429 | 1,371 | 1,462 | -4.1 |
| Claims | 4,066 | 4,427 | 4,046 | 3,979 | -8.6 | |
| Ontario | Hours | 15,146 | 16,167 | 14,448 | 15,658 | -10.6 |
| Claims | 23,763 | 24,805 | 19,241 | 17,770 | -22.4 | |
| Transportation | ||||||
| British Columbia | Hours | 4.596 | 4,440 | 3,941 | 4,210 | -11.2 |
| Claims | 8,167 | 8,225 | 5,053 | 6,205 | -38.6 | |
| Alberta | Hours | 4,216 | 3,994 | 3,891 | 3,991 | -2.6 |
| Claims | 5,317 | 5,879 | 4,407 | 4,318 | -25.0 | |
| Saskatchewan | Hours | 1,018 | 956 | 959 | 1,017 | 0.3 |
| Claims | 1,835 | 1,884 | 1,673 | 1,609 | -11.2 | |
| Manitoba | Hours | 1,393 | 1,390 | 1,442 | 1,330 | 3.7 |
| Claims | 2,415 | 2,328 | 2,250 | 2,186 | -3.4 | |
| Ontario | Hours | 10,957 | 11,802 | 11,061 | 11,108 | -6.3 |
| Claims | 17,951 | 17,847 | 14,726 | 13,425 | -17.5 | |
Significance of findings
Economic theory and empirical evidence cited in IWH’s 2009 Issue Briefing (“Workers’ compensation and the business cycle”) indicated that recessions tend to result in reductions in the rate of compensation claims per hours worked, relative to the general long-term trend towards lower claim rates (Brooker and Sullivan,1994; Brooker, Frank and Tarasuk, 1997; Hartwig et al., 1997; and Ussif, 2004). Available theory and evidence point to a number of explanations. It is well established that inexperienced workers are at a higher risk of injury compared to experienced workers (Breslin and Smith 2006; Shuford 2008). During recessions, layoffs, closures and reduced hiring lead to fewer inexperienced workers on the job, and thus fewer workplace injuries (Kossoris, 1938).
In addition, it is often the most hazardous industries that experience the largest decline in employment during recessions. With fewer workers on the job, the oldest (and usually least safe) equipment may be taken out of use. Further, during economic downturns, the pace of work is slower, which reduces the risk of work-related injury and illness. And finally, workers fearing job loss may defer filing claims out of concern about the likelihood of successfully returning to work. During a recession, all of these factors in combination result in a decline in the filing of compensation claims that is more substantial than the corresponding declines in employment and hours of work.
In the case of the economic downturn of 2008 to 2009, the frequency of claims in five provinces fell much more sharply than the decline in hours worked. Moreover, those provinces hit hardest by the recession (as measured by the drop in hours worked), experienced the sharpest declines in claim volume. The construction sector was substantially affected by this current recession, and predictably saw substantially larger drops in claim volume compared with the health-care industry, where hours of employment were largely unaffected.
Key drivers
Perhaps the central question arising from a dramatic reduction in compensation claim frequency following the onset of the Canadian recession is the relative share of the reduction that can be attributed to lower workplace risk for injury and illness, and the share that can be attributed to discretionary decisions on the part of workers and employers concerning the filing of claims. The methods of this Issue Briefing cannot confidently address this question.
We do, however, offer two observations that reinforce the plausibility of lower workplace risks as the dominant factor underlying the dramatic reduction:
- First, in Ontario between 2008 and 2009, there was a 17.6 per cent reduction in the number of emergency department visits attributed to a work-related cause, compared to a five per cent reduction between 2007 and 2008 (Mustard et al., 2011). The attribution of a work-related cause by clinical staff in emergency departments is unrelated to the administration of a workers’ compensation claim in this setting.
- Second, we repeat the observation noted earlier: The decrease in NLTCs was greater than or equal to the observed declines in LTCs. While the reduced job security experienced by workers during recessions likely contributes to fewer injured workers willing to file LTCs, workers injured on the job would presumably still continue to seek medical care for their injuries, such that the ‘chilling effect’—that is, the inhibiting consequence—of a recession on the willingness of injured workers to file claims ought to be diminished in the case of NLTCs. This suggests that the ‘chilling effect’ of recessions on the filing of claims may not have played a particularly prominent role in the reduction of claims rates, and thus that the decrease in the volume of claims seen in Canada between 2008 and 2009 was due primarily to a reduction in those exposures that result in work-related injury and illness.
Conclusion
The 2009 Issue Briefing published by IWH noted that research on workers’ compensation claims trends over the business cycle suggested that, relative to the long-term trend towards lower claim rates, the frequency of workers’ compensation claims per hours worked tends to decline in recessions and increase during times of economic recovery. The 2008-2009 recession saw a sharp decline in claim rates in the five Canadian provinces we studied, consistent with what would be expected based on this research. Moreover, the provinces with the sharpest decline in hours worked experienced the largest declines in claim frequency, and the claim rates fell much more sharply in the construction sector, where there was substantial employment loss, than they did in the health-care sector, where hours of employment were largely unaffected. Although the key drivers of these trends remains an open question, our data nevertheless suggest that recessions are associated with a reduction in the risk of work injury.
References
- Breslin FC, Smith P. Trial by fire: A multivariate examination of the relation between job tenure and work injuries. Occupational and Environmental Medicine, 2006; 63 (1): 27-32.
- Brooker AS, Frank J, Tarasuk VS. Back pain claim rates and the business cycle. Soc Sci Med, 1997; 45(3):429-439.
- Brooker AS, Sullivan T. Workers’ compensation and the business cycle. On Workers’ Compensation,1994; 3:144-146.
- Hartwig RP, Kahley WJ, Restrepo TE, Retterath RC. Workers’ compensation and economic cycles: A longitudinal approach. Proceedings of the Casualty Actuarial Society, 1997; 84:660-700. Available at: www.casact.org/pubs/proceed/proceed97/97660.pdf
- Institute for Work & Health. Workers’ compensation and the business cycle. Issue Briefing, March 2009. Available at: www.iwh.on.ca/briefings/business-cycle
- Kossoris MD. Industrial injuries and the business cycle. Monthly Labour Review, 1938; 46(3):579-594.
- Mustard CA, Cole DC, Shannon H, Pole J, Sullivan T, Allingham R, Sinclair S. Declining trends in work-related morbidity and disability 1993-1998: A comparison of survey estimates and compensation insurance claims. American Journal of Public Health, 2003; 93:1283-1286.
- Mustard CA, Chambers A, McLeod C, Bielecky A, Smith PM. Comparison of data sources for the surveillance of work injury. Occupational and Environmental Medicine, 2011. ePub 2012 Jan 12. doi:10.1136/oemed-2011-100222.
- Shuford H. Workers’ compensation and the business cycle: An overview. Presentation to Annual Convention of the International Association of Industrial Accident Boards and Commissions, Vancouver, October 30, 2008.
- Ussif A. An international analysis of workplace injuries. Monthly Labor Review, 2004; 127(3): 41-51.
Acknowledgements
IWH would like to thank Bruce Ceilen and Barry Warrack from the Workers Compensation Board of Manitoba and Rhonda Bridger from Ontario’s Workplace Safety and Insurance Board for their assistance in acquiring key data for this project. We appreciate the helpful comments and suggestions provided by Terry Bogyo of WorkSafeBC.